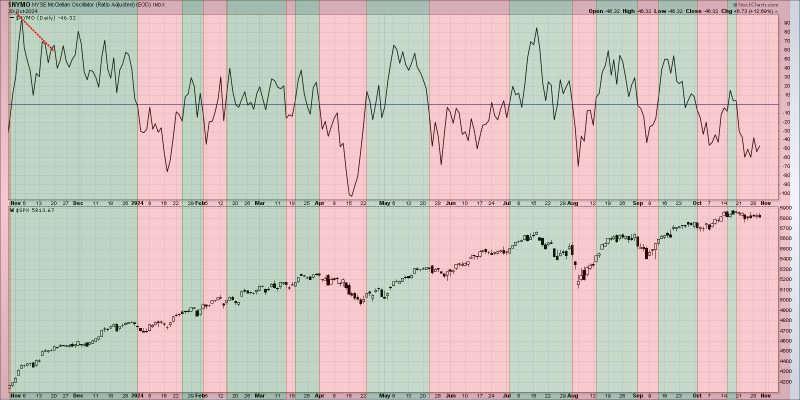
In the dynamic world of financial markets, technical analysis plays a vital role in helping traders and investors make informed decisions. One intriguing concept within technical analysis is breadth divergences, which can provide valuable insights into market trends and potential reversals. As we delve into this topic, we aim to unravel the significance of breadth divergences and analyze whether they could signal the end of a bullish trend.
Breadth divergences refer to discrepancies between the performance of a stock market index and the underlying breadth indicators. Breadth indicators, such as the advance-decline line or the McClellan Oscillator, measure the number of advancing and declining stocks in the market. When a breadth indicator diverges from the price movement of a major index, it may indicate underlying weakness or strength in the market that is not reflected in the headline index.
One common type of breadth divergence is a negative or bearish divergence, which occurs when the market index reaches new highs, but the breadth indicator fails to confirm the upward momentum. This scenario suggests that the market rally is not supported by a broad participation of stocks and may be vulnerable to a reversal. Conversely, a positive or bullish divergence occurs when the market index is in a downtrend, but the breadth indicator shows increasing strength among individual stocks. This divergence could signal a potential reversal to the upside.
Identifying breadth divergences requires a keen eye and a thorough analysis of market internals. Traders often utilize various tools and techniques to monitor breadth indicators alongside price movements to spot potential divergences. By observing subtle shifts in market breadth, traders can gain a better understanding of the underlying market dynamics and anticipate trend changes before they materialize.
While breadth divergences can provide valuable insights, they are not foolproof indicators of future market movements. It is essential to consider other factors, such as macroeconomic conditions, geopolitical events, and fundamental data, when making trading decisions. Additionally, false signals and temporary divergences can occur, requiring traders to exercise caution and validate their analysis with multiple sources of information.
In conclusion, breadth divergences serve as a valuable tool in the arsenal of technical analysts, offering unique perspectives on market trends and potential turning points. By monitoring the relationship between market indices and breadth indicators, traders can uncover hidden signals that may not be apparent on the surface. While breadth divergences can be complex and require a nuanced understanding of market dynamics, they have the potential to enhance trading strategies and improve decision-making in an ever-changing market environment.
