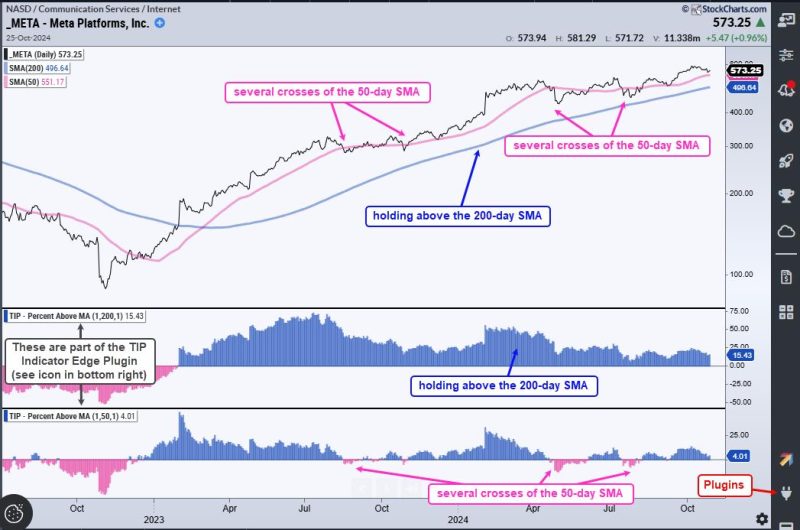
Indicator 1: Market Structure Analysis
One of the key indicators that traders can utilize to enhance their edge in the financial markets is market structure analysis. Market structure analysis involves the identification and interpretation of various market patterns, trends, and price movements to understand the underlying dynamics of the market. By analyzing market structure, traders can gain valuable insight into the supply and demand dynamics, the behavior of market participants, and potential future price movements.
Market structure analysis typically involves the use of technical analysis tools such as support and resistance levels, chart patterns, and trendlines. By identifying key support and resistance levels on price charts, traders can determine the potential direction of the market and identify important levels where price action may reverse or accelerate. Additionally, chart patterns such as head and shoulders, triangles, and double tops/bottoms provide traders with valuable information about market sentiment and potential price reversals.
Another important aspect of market structure analysis is the interpretation of trendlines. Trendlines are used to connect the highs and lows of price movements on a chart and provide traders with a visual representation of the market trend. By drawing trendlines and identifying key trend reversal points, traders can anticipate potential trend changes and adjust their trading strategies accordingly.
Overall, market structure analysis is a powerful indicator that can help traders improve their edge in the financial markets by providing valuable insights into market dynamics, trends, and price movements. By utilizing market structure analysis in conjunction with other technical analysis tools, traders can make more informed trading decisions and increase their chances of success in the markets.
Indicator 2: Volume Analysis
Volume analysis is another important indicator that traders can use to enhance their edge in the financial markets. Volume refers to the number of shares or contracts traded in a particular security or market during a specified period of time. By analyzing volume data, traders can gain insights into the level of participation and interest in a particular security or market, as well as the strength of price movements.
One of the key ways in which traders can use volume analysis to improve their edge is by examining volume spikes. Volume spikes occur when there is a significant increase in trading volume compared to the average volume for a particular security. These volume spikes often indicate strong interest or participation in a security and can signal potential trend reversals or continuations.
In addition to volume spikes, traders can also analyze volume trends to gain insights into the overall market sentiment and direction. For example, increasing volume on an uptrend may indicate strong buying interest and the potential for further price appreciation, while decreasing volume on an uptrend may signal weakening momentum and a potential trend reversal.
Furthermore, traders can use volume analysis in combination with other technical indicators such as moving averages, oscillators, and support/resistance levels to validate trading signals and confirm potential entry or exit points. By incorporating volume analysis into their trading strategies, traders can improve their ability to identify high-probability trading opportunities and reduce the risk of making emotional or impulsive trading decisions.
In conclusion, volume analysis is a valuable indicator that traders can use to enhance their edge in the financial markets by providing insights into market participation, sentiment, and price movements. By incorporating volume analysis into their trading strategies and combining it with other technical indicators, traders can gain a more comprehensive understanding of market dynamics and increase their profitability in trading.
