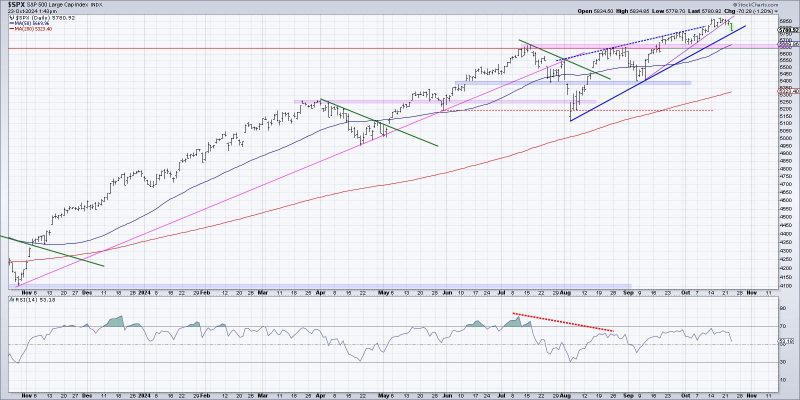
In the realm of stock market analysis, identifying potential distribution phases can be crucial for investors aiming to optimize their portfolio strategies. Visualizing the start of a distribution phase is a key skill that can help market participants make informed decisions and avoid potential pitfalls. Here are three effective ways to visualize the beginning of a distribution phase:
1. Volume Analysis:
Analyzing trading volume is a fundamental aspect of technical analysis that can provide valuable insights into the beginning of a distribution phase. During the early stages of a distribution phase, you may observe a decline in trading volume compared to previous levels. This drop in volume indicates a potential lack of interest or participation from market participants, suggesting that the stock may be transitioning from accumulation to distribution. By monitoring volume patterns, investors can anticipate shifts in market sentiment and better assess the likelihood of a distribution phase.
2. Price Action:
Another effective method to visualize the start of a distribution phase is through careful analysis of price action. During this phase, you may notice a series of lower highs and lower lows forming on the price chart, signaling a potential shift in market dynamics. Additionally, the presence of bearish reversal patterns, such as head and shoulders formations or double tops, can further support the notion of a distribution phase. By studying price patterns and recognizing key technical signals, investors can gain a more comprehensive understanding of market trends and position themselves accordingly.
3. Moving Averages:
Utilizing moving averages can offer valuable insights into the development of a distribution phase. By comparing shorter-term moving averages (e.g., 50-day or 20-day) with longer-term moving averages (e.g., 200-day), investors can gauge the overall trend and momentum of a stock. During the early stages of distribution, you may observe a bearish crossover between these moving averages, indicating a potential shift from bullish to bearish sentiment. Additionally, tracking the divergence between price and moving averages can help investors identify potential areas of weakness and anticipate a distribution phase.
In conclusion, visualizing the start of a potential distribution phase is a critical skill for investors looking to navigate the complexities of the stock market. By incorporating volume analysis, price action interpretation, and moving average techniques into their analysis, investors can enhance their ability to identify early signs of distribution and adapt their investment strategies accordingly. By staying vigilant and employing a multi-faceted approach to visualization, investors can gain a competitive edge in the ever-changing landscape of the financial markets.
